Troubleshooting
InstallBuilder provides a number of features to help you debug failing installations. Installations can fail either because of internal factors (such as faulty logic) or external factors (such as running out of disk space)
Debugger
InstallBuilder allows including an embedded debugger within your installers. This built-in debugger makes easier to identify and correct issues, speeding and simplifying installer development. Its main features, detailed in successive sections, are:
-
Viewing and interactively editing installer variables at runtime.
-
Extended logging in the built-in log widget.
-
Step-by-step execution.
-
Allows recovering from unexpected errors during the installation.
Including the debugger in your installer
Packing the debugger is completely optional and configurable at build-time through the <enableDebugger> setting:
<project>
   ...
   <enableDebugger>1</enableDebugger>
   ...
</project>
This is very convenient when you do not want to allow your users to inspect the internals of the installer or simply to avoid the size overhead introduced (around 1.5MB).
Take into account that the setting is only considered when performing full builds. If you try to include the debugger in an existing installer (that does not already include the debugger) using the quickbuild, the builder won’t pack it.
Similarly, you cannot remove the debugger from an existing installer by setting <enableDebugger>0</enableDebugger> and performing a quickbuild. However, although the debugger will be still packed, it won’t be accessible at runtime so the only drawback will be the increment in size mentioned above.
Enabling the debugger at runtime
If the debugger was packed at build-time, it will be available at runtime by launching the installer from a console prompt as:
$> ./sample-1.0-windows-installer.exe --enable-debugger
If the debugger was not packed, the command line flag won’t be available and thus you will get an error.
As the debugger is only available in xwindow, win32, osx and unattended modes, calling the installer with --enable-debugger will also reconfigure the graphical mode to the appropriate one in the running platform:
-
win32: On Windows -
osx: On Mac OS X -
xwindow: On Linux (and other Unix platforms but OS X) -
unattended: When the installer is also launched with--mode unattended(all platforms allow it)
Testing installers with the debugger
InstallBuilder builder GUI provides an easy way to run the debugger.
To test your installer with the debugger enabled, simply click the Debug Run button.
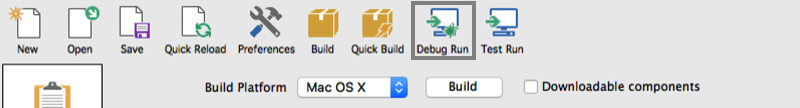
It will run a build of the installer to ensure it contains the debugger enabled and then start it with the debugger enabled.
If the installer does not currently have the debugger enabled, a full build of the installer will be made.
A quick build will be made if installer already has the debugger enabled - either <enableDebugger> setting enabled or was last built by clicking on the Debug Run button
Debugger usage
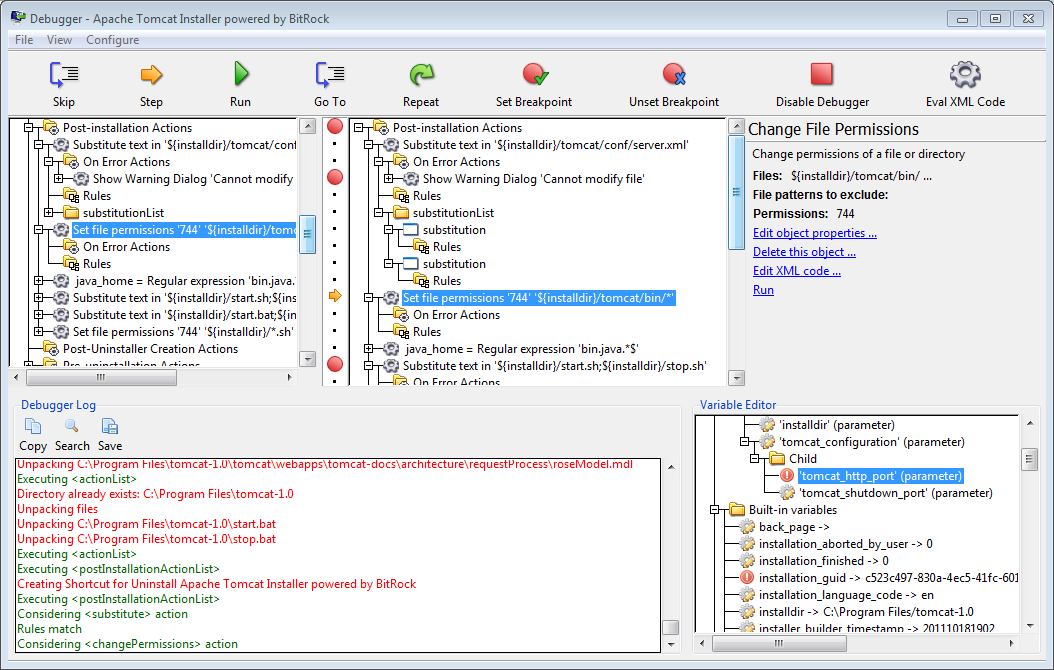
When the installer is started with the debugger enabled, it will cause the debugger window to be shown in addition to the installer window:
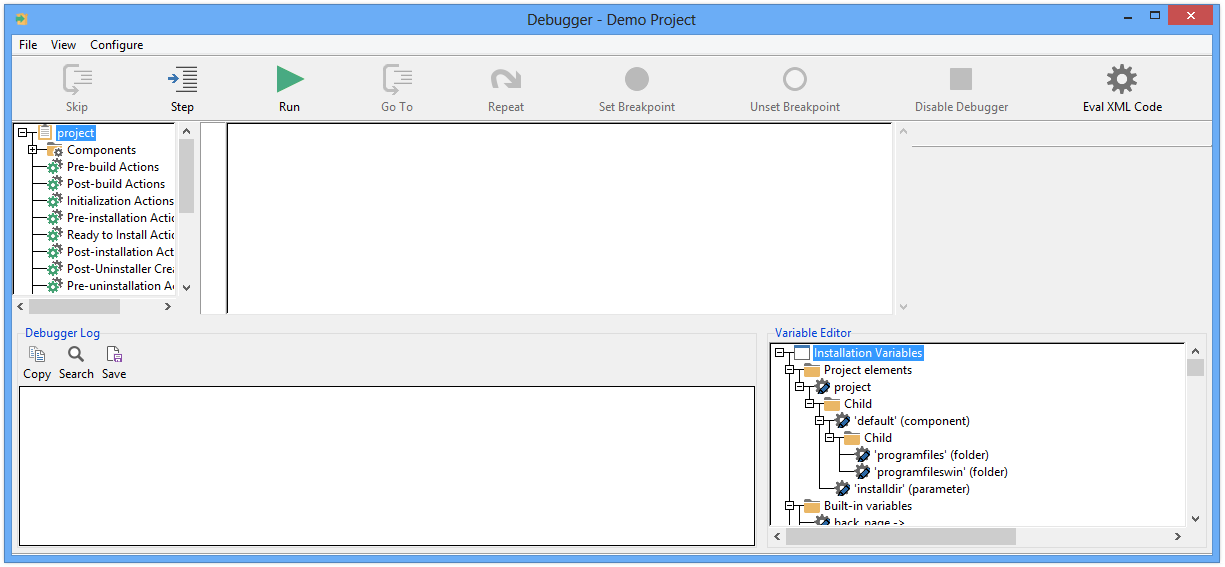
After the debugger is initialized, it will keep waiting until the run button is clicked, and then the installer will start the installation (the <initializationActionList>). This allows you to set the appropriate breakpoints in those sections of your project that require debugging.
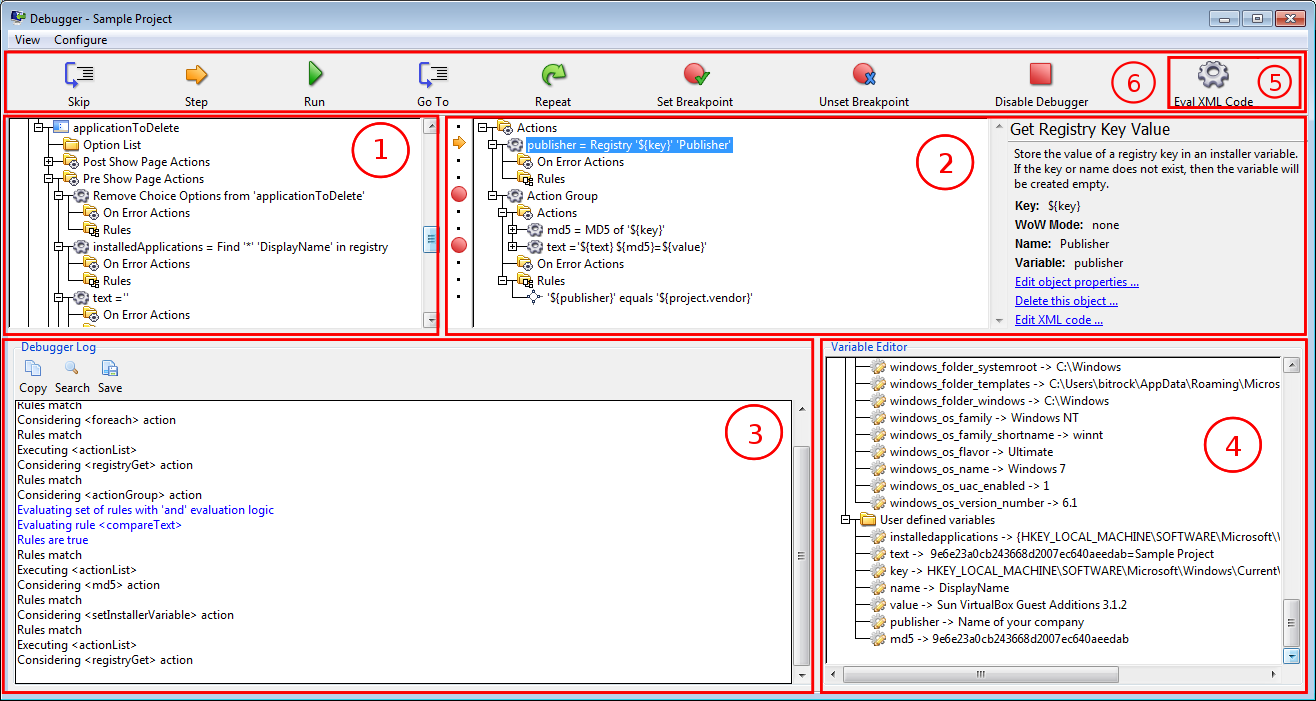
The debugger includes five main tools:
-
Project tree editor
(1): A full tree that allows basic modifications of the overall project. Some features such as adding and removing parameters, folders and components are disabled. -
Action List Execution Editor
(2): A tree displaying the current action list being executed. The action lists are just loaded if they contain any<breakpoint>or if the debugger entered the action list in astep. -
Debugger log
(3): A configurable log including information about the installed files, executed programs, standard streams, actions, rules… -
Variable Editor
(4): A tree allowing the creation, editing and visualization of installer variables and project settings. -
XML evaluator
(5): Allows executing arbitrary InstallBuilder XML code with the same context of the installer (same variables and parameters).
It also includes a control toolbar ((6)) and a menu to configure the debugger.
The toolbar
The debugger toolbar is used to control the behavior of the debugger. The below listing explains the usage of its buttons:
-
Step, Skip, Run, Go To, Repeat, Set Breakpoint, Unset Breakpoint: Used to control the
Action List Execution Editor. -
Disable Debugger: When the debugger is disabled, it does not stop at breakpoints or log messages. This speeds up the execution in big projects until the installation reaches the desired point or simply lets the installation finish after you are done with the debugging.
-
Eval XML Code: Launches the
XML evaluatordialog.
Project tree editor
The project tree editor allows basic modifications of the project. It is especially useful when the debugger is initialized, before the execution of the installer starts, to set breakpoints in the desired actions to debug.
To set a breakpoint on an action or action list, right-click on the desired element and select Set Breakpoint (or Unset Breakpoint if it is already set).
Its behavior is similar to the GUI builder tree. To modify an element such as a component, action or rule, just double-click it. New actions can also be added by double-clicking on an action list.
The tree can be also hidden from the "View" menu by unchecking "Main Tree".
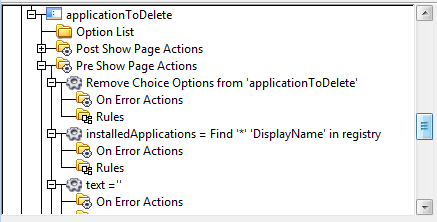
Action List Execution Editor
When an action list contains a breakpoint (either in the action list or in any of its child actions) or the debugger stops at it because of a step, it is loaded in the Action List Execution Editor. The action list is represented in a tree with a left strip, displaying the breakpoints (represented by red dots) of the actions and the action being executed (marked by an orange arrow).
The tree allows moving, deleting and editing the actions, as well as adding new ones. It supports editing them either using the GUI pop-ups or using the built-in XML editor.
It also supports some operations, controlled by the main toolbar:
-
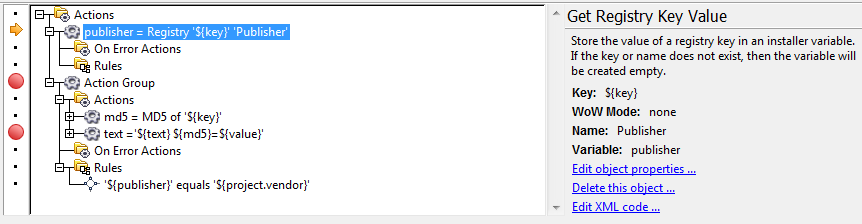
Skip: When the debugger is stopped at a breakpoint or because it was performing anstep, clicking on theSkipbutton will make the debugger jump to the next action. In the figure, the next action is a<registryGet>action, by clickingSkip, the debugger will not execute it and step into the next one, the<actionGroup>. -
Step: Allows the debugger to execute actions step by step. This is useful for reviewing the results of each action in the log or theVariable Editor. -
Run: Makes the debugger continuously execute actions until a breakpoint is reached. -
Go To: Allows jumping to any of the actions in the loaded action list. The appropriate action must be selected before clicking the button. -
Repeat: This button makes the debugger execute the current action without stepping into the next one afterwards. This is useful for troubleshooting an action that is failing by trial and error, for example, a regexp not matching. -
Set Breakpoint: This button sets a breakpoint in the selected action. Alternatively, you can click on the left strip in the desired position. -
Unset Breakpoint: This button unsets a breakpoint in the selected action. Alternatively, you can click on the left strip in the desired position.
If an error occurs in the action list being executed, the debugger will capture it before it is thrown and will display a dialog with the details and ask for the action to perform:
-
Abort: Throws the error (the regular behavior)
-
Execute Actions and Abort: Allows executing some custom actions and then throws the error.
-
Ignore: The error is just ignored.
-
Execute Actions and Ignore: Allows executing some custom actions and the error is ignored. This is helpful for recovering from errors and continue with the installation.
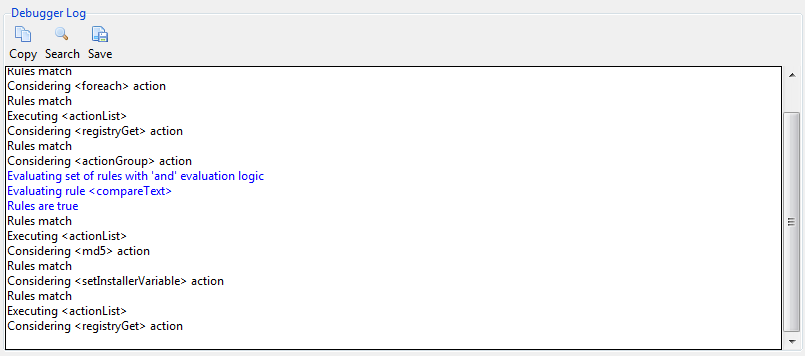
Debugger log
The debugger log allows configuring which elements to log as well as the verbosity and color of the messages. These settings can be configured in the Log section of the Configure->Preferences menu. The configurable elements to log are:
-
Actions: Actions executed, its properties before the execution.
-
Rules: Evaluated rules with their results and properties.
-
Tracked Variables: A message is logged when a variable being tracked (using the
Variables Editor) is modified. -
Installation logs: The messages written in the installation log.
Apart from these elements, the debugger also logs the stdout, stderr (in red color) and exit code of all executed programs.
The log also allows saving its contents, copying the selected text and searching for specific entries.
The widget can be also hidden from the "View" menu by unchecking "Debugger log".
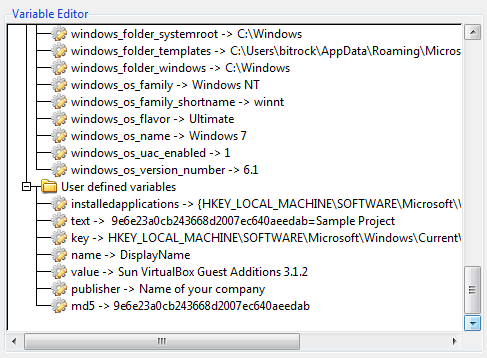
Variable Editor
The Variable Editor is displayed as a tree with three main branches:
-
Project Elements: Displays all of the referenciable project elements (using the advanced syntax) in a hierarchical way. All of the elements can be modified but new elements cannot be added. The text in the tree displays the key name of the element (usually the
<name>property) and its type (component,folderorparameter). -
Built-in variables: Displays all the built-in variables. Its values can be manually added but it does not allow adding new elements. The text in the tree displays the name of the variable and a preview of its contents (or the full value if it is not very long).
-
User defined variables: Displays the variables created by the user through
<setInstallerVariable>actions (or similar). It allows modifying the values of existing elements as well as adding new ones, which will result in the creation of new installer variables. The text in the tree displays the name of the variable and a preview of its contents (or the full value if it is not very long.)
In addition to manipulating the installation variables and project elements, the widget also allows marking elements to be tracked by the debugger. When a tracked variable (or project element) is modified, a message will be written in the debugger log, detailing the new contents of the variable. To mark a variable, right-click on the desired element and select Track Variable (or Untrack Variable if it is already being tracked). If the item to track is a project element, the contextual menu will display an entry Track Object Menu, that will allow selecting the settings to track.
The widget can be also hidden from the "View" menu by unchecking "Variable Editor".
XML evaluator
The XML evaluator allows executing any XML code with the same installer environment (same variables and parameters) of the installation:
Logs
Installation Log
Where the Log is Located
All InstallBuilder installers create an installation log in the system’s temporary directory.
The exact location of the log file is stored in the ${installer_installation_log} variable. On Linux, Mac OS X and other Unix systems, this typically means the /tmp directory. On Windows, the log
will be created in the user’s local Temp directory, usually C:\Users\Username\Appdata\Local\Temp.
The default name of the generated log file is bitrock_installer.log, but if the file already exists from a previous installation, the installer will try to create an unique filename trying bitrock_installer_[pid].log and bitrock_installer_[pid]_[uid].log where [pid] is the PID of the process and [uid] is an unique identifier.
|
Note
|
The system Temp directory is stored in the built-in variable |
You can use the <installationLogFile> and <uninstallationLogFile> project properties to specify an alternate location for the log file once the installation has completed. Of course,
the initial log file is still created in the temporary directory, because the new location specified with that tag probably does not exist when the installer first runs.
<project>
   ...
   <!-- Configures the final destination of the installation log -->
   <installationLogFile>${installdir}/${project.shortName}-installLog.log</installationLogFile>
   <!-- Configures the final destination of the uninstallation log -->
   <uninstallationLogFile>${system_temp_directory}/${project.shortName}-uninstallation.log</uninstallationLogFile>
   ...
</project>
It is possible to also mark a log file for deletion after the installation has completed.
<project>
   ...
   <removeLogFile>1</removeLogFile>
   ...
</project>
Verbosity Level
Most common errors during installation are related to the execution of third party programs or system commands. The installation log will include the stdout and stderr output of the program, as well as the exit code:
Executing /home/user/lampstack-1.2-2/php/bin/php -q /home/user/lampstack-1.2-2/php/bin/fixreg.php  /home/user/lampstack-1.2-2/php
Script exit code: 0

Script output:
Patching /home/user/lampstack-1.2-2/php/lib/php/.registry/archive_tar.reg
Patching /home/user/lampstack-1.2-2/php/lib/php/.registry/console_getopt.reg
Patching /home/user/lampstack-1.2-2/php/lib/php/.registry/pear.reg
Patching /home/user/lampstack-1.2-2/php/lib/php/.registry/structures_graph.reg
Patching /home/user/lampstack-1.2-2/php/lib/php/.registry/xml_util.reg

Script stderr:
By default, standard streams are always logged independently of whether or not the execution succeeds but the debug level can be decreased to only log them after an error:
<project>
  ...
  <!-- Levels from 2 to 4 displays the streams -->
  <debugLevel>0</debugLevel>
  ...
</project>
This will log the standard streams only in the event that an error occurs. Reducing the debug level also prevents the arguments for the programs being executed from being logged. This can be useful if as part of the installation you are passing sensitive information as command line options and you do not want it stored
in the log file. A better approach is to add a .password suffix to the variable reference.
Logging custom information
You can add custom information to the log at runtime using the <logMessage> action. It is possible to specify an optional, custom timestamp:
  <logMessage>
     <text>Uninstalling old installation...</text>
     <timeStampFormat>[%H:%M:%S]</timeStampFormat>
     <enableTimeStamp>1</enableTimeStamp>
  </logMessage>
You could also use the <writeFile> and <readFile> actions to include important information from log files from other programs.
<preInstallationActionList>
  <readFile name="apacheErrorLog" path="${installdir}/apache2/log/error_log"/>
  <logMessage>
     <text>Apache Error Log:</text>
     <timeStampFormat>[%H:%M:%S]</timeStampFormat>
     <enableTimeStamp>1</enableTimeStamp>
  </logMessage>
  <writeFile text="${apacheErrorLog}" path="${project.installationLogFile}"/>
</preInstallationActionList>
Debugtrace Log
If you run into issues that are hard to track down, you may be asked to provide a debug trace. This is an internal dump of the inner workings of the installer, serialized as an XML file. It can help the support team determine the root cause of the problem.
Both the Builder and the generated installers are capable of generating the debug file. You just need to use the --debugtrace flag:
$> sample-1.0-linux-installer.run --debugtrace debug.txt
Debug file written.
You can then send the debug.txt file to support@bitrock.com. Please provide as much context information as possible.
|
Note
|
Take into account that the log is only serialized when the installer exits normally, either completing the installation or crashing with an error, but not if the process is killed by external methods. |
Syncdebugtrace Log
The normal debug trace is accumulated in memory and at the end of the installation it is encrypted and mapped to an xml. This has the benefit that it does not slow down the installation process, but for large projects it can be heavy on memory. In this case you can use the sync debug trace. This option generates the debug file in real time, so while - and not after - the installer is running. This is less memory consuming but at the same time it may slow down the installation process.
$> sample-1.0-linux-installer.run --syncdebugtrace debug.txt
Debug file written.
Other Debugging Methods
As when debugging any program, the most basic (but useful nonetheless) method of debugging is to provide information of what is going on at different points in the process. This helps you determine if what is happening is indeed what you were expecting to happen at that particular point in time. You can use a <showInfo> action to display messages during the installation process.
This technique can help, for example, when debugging why an action seems not to be executed:
   <showInfo text="About to run the program" />
   <actionGroup>
     <actionList>
        <showInfo>
          <text>Sharing the same rules will check that they are correctly evaluated"</text>
        </showInfo>
        <runProgram>
          <program>chown</program>
          <programArguments>-R username ${installdir}</programArguments>
        </runProgram>
     </actionList>
     <ruleList>
        <platformTest type="linu"/>
     </ruleList>
  </actionGroup>
  <showInfo text="After executing the program"/>
If you run an installer that includes the above code, you will see the first and the third pop-ups, so something is wrong with the rule. A closer look will make you realize that the type field in the
platformTest rule has a typo. It reads linu, when it should be linux. This particular case will be automatically reported to you by the builder when loading the project but other issues are
tackled the same way.
A similar approach can be used to check that variables have the expected value:
   <setInstallerVariable name="docLocation" value="${intalldir}/doc"/>
   ...
   <renameFile origin="${intalldir}/app/oldDocDirectory" destination="${docLocation}"/>
The above code will not work because of a typo (${intalldir} instead of {installdir}). Adding a <showInfo> help will help track the issue:
   <setInstallerVariable name="docLocation" value="${intalldir}/doc"/>
   ...
   <showInfo text="Documents are stored in ${docLocation}"/>
   <renameFile origin="${intalldir}/app/oldDocDirectory" destination="${docLocation}"/>
It will display: Documents are stored in ***unknown variable intalldir***/doc